Wednesday, December 29, 2010

Final Lesson: The Electromagnetic Spectrum. A connection between Astronomy and Chemisty


Introduction
Making connections between two major branches of science when teaching middle school  can be a challenge.  Making these connections helps students link their lives to everyday science and its phenomena. 
Starry Night software program.  The sky looking North at 20:37 Dec 29th from Indian, AK

Before starting a unit on chemistry, I make sure I end my Astronomy unit with stars and constellations of the Northern sky.  The study of stars is a great place to introduce elements and the chemical interactions that make up the 8th grade curriculum.
This is a photo taken by the X-Ray Telescope (NASA) of an exploding star
  The following lab engages middle school students in an exercise involving astronomy, chemistry, and a cultural connection to the stars.

Background
The light radiating from the stars in the sky can be visible and invisible to the naked eye.  This energy is known as electromagnetic radiation.
The Electromagnetic Spectrum.  Graphic from http://www.kollewin.com/blog/electromagnetic-spectrum/

The light we can see is only one type of electromagnetic radiation.  Stars can give off radiation you can’t see such as radio or ultraviolet light.

Electromagnetic radiation can be broken into ranges based on the size of their wavelength.  All of the different types of electromagnetic waves make up the electromagnetic spectrum

Light will travel in waves and those waves have troughs and peaks that are long or short depending on the energy.  This spectrum can tell astronomers the temperature and even the composition of the stars.

Astronomers not only use visible light telescopes but radio and x ray telescopes to capture and analyze the energy from distance stars.


http://www.pa.uky.edu/sciworks/physicspettingzoo/Spectroscope.htm

Astronomers use a tool called a spectroscope to capture visible light and break it into a spectrum that can be analyzed for the presence of different elements.
http://webmineral.com/help/FlameTest.shtml 

As you can see from the spectrogaph, each element has a specific wavelength, or fingerprint, of light.  Most light (visible), can be separated into component wavelengths.  This separation is from the spectroscope’s prisms or diffraction grating.  Of the three types of spectra:  continuous, emission, and absorption, the last two can be used as “fingerprints” in the identification of elements. 

Each element in its gaseous form will give off light in definite wavelengths.  Elements and compounds can be identified by the light they absorb through  bright lines in the spectrum. These are measured in Angstroms, through the Spectroscope (see example). 


The lab

Flame Test, Spectroscopes, and Stars

Photo by author

Question:            How can we determine the metals in certain solutions?

Purpose:            To understand that metals lose energy in the form of light and this light can be broken up into a spectrum resulting in different wavelengths that can be analyzed  into a known line spectrum of different elements.

Materials:             
  • Bunsen Burner             
  • Test Tubes (6)                                     
  • Test tube rack                                         
  • Goggles                       
  • Nichrome wire                                   
  • 5 metal solutions
  • HCl solution               
  • distilled water                                     
  • spectroscope
                                                                               
 Procedure:     1.  Label the test tubes A – E
2.     Pour 5ml of from each of the labeled solutions into corresponding labeled test tube.
3.     Clean the nichrome wire by dipping it into the HCl solution provided to you and then the distilled water and drying it in the Bunsen burner.  Repeat until the wire doesn’t color the flame form the Bunsen burner.
4.     Dip the clean wire into one of the labeled test tubes solutions.  Hold the wire at the inner cone of the flame.  Record color and any other observations in the data table.
5.     Using the spectroscope, find the metal’s spectrum by looking at the flame.  Look for any dark lines and note what color they are in.
6.     Diagram your spectrum or use the textbook (page 100, Fig 4) to find the element’s line spectrum.
7.     Repeat steps 2-4 for the other chloride solutions.
8.     Please rinse out all test tubes and clean your area.

Data:

Test Tube

Color

Solution

A


B


C


D


E


Conclusions:            If your test solution was a mixture of two metal ions, could you identify both?  Try it.  Try the spectroscope and see if you can see two different lines.

Photo by author

Questions


            1.  What is a spectrum?  How is a spectrogram useful in studying stars?

            2. Why is it necessary to clean the wire between each test?
           
3.  Some flame tests were very apparent in the color produced while others were more vague.  What do you think are some reasons that could account for this?

            4.  How do the samples resemble stars?  How can scientists tell what elements are in a distant star?

            5.  Diagram the Bunsen Burner equipment and show a correct flame.  Label all parts.  Color is an option.

Enrichment
The lab is a fun way to explore why stars give off light in different colors and a lot of students feel they are doing "real" science.  The problem is sometimes its hard to see through the spectroscopes and see any prisms especially the lines.  Other labs use different types of lamps and lights to find known elements and using one of these would be a great demonstration or lab on its own.

The Discovery video collections have great videos as we well know.  My favorites are the ones  we have already used in this class and I plan on using them in mine!

Another video that gets the kids excited about chemistry is KABOOM!.  The interaction of different elements makes for cool chemistry.
http://www.teachersource.com/Chemistry/ChemistryResources/KABOOM_NovaVideo.aspx

Cultural connection
There are many stories about the stars and the patterns they make in the sky.  Ancient Greek and Roman stories abound.  But other cultures have stories that would interest most middle school students.  The  Alaskan natives for example have several stories of the strange lights that appear in the sky. These stories can be used as introductory lessons to get the students thinking about the constellations and a spark for their imagination in making up their own stories of the stars.

I especially love the stories of the Northern Lights and have heard several versions of the gods in the sky playing kickball with a skull.  Many elders I have known are still afraid of the
Aurora.

The state flag of Alaska is also a great introduction of the night sky and connections to Native Alaskans.  

Conclusions
I have done the flame test lab several times as a demo and as a real lab.  By using the new resources on the web and our own video library at Discover, I think this lab activity will help middle school students grasp the connection between the different branches of science and allow them to make these connections on their own through life long learning.  

Please feel free to email me to get the word flame test document and feel free to use it and modify it for your classroom.  mittelstadt_konrad@asdk12.org

Its been a great class have a great New Years........

References

Pasachoff, J. M.,  Astronomy Prentice Hall, Nedham, Mass 2000.

http://imagine.gsfc.nasa.gov/docs/science/how_l1/spectra.html

http://webmineral.com/help/FlameTest.shtml

http://www.trschools.com/staff/g/cgirtain/Weblabs/spectrolab.htm

http://www.wwu.edu/depts/skywise/legends.html

http://starryskies.com/articles/dln/5-97/native.myths.html

http://www.angelfire.com/ca/Indian/WhyStars.html

http://www.museums.state.ak.us/eightstars/resources_bibliography.html

http://www.ewebtribe.com/NACulture/articles/aurora.html

http://imagine.gsfc.nasa.gov/docs/dictionary.html#S

http://www.astrosociety.org/

http://www.exo.net/~pauld/summer_institute/summer_day9spectra/spectra_exploration.html

http://www.stsci.edu/portal/

http://imagine.gsfc.nasa.gov/docs/teachers/lessons/roygbiv/roygbiv.html


Saturday, December 18, 2010

Module IX Tales of Drunken Trees, Methane Bombs & Glacier Blues


 The Learning
Viewing the TD videos allowed me to gather valuable information on the module’s topic this week.  I found them to be full of great photography and content for students to see first hand. 

The pictures of “drunken trees” and the stories of lakes disappearing around Huslia was quite an eye opener.  I found it a little ironic of the talk about decreasing the use of fossil fuels to help combat this problem but in the next scene, kids and adults are cruising around the village on snow machines or four wheelers.  You can’t take the outboard off the boat if you are going up river?!
The thawing of ice-rich permafrost causes subsidence of the land surface, creating thermokarst ponds and causing trees to tilt, which is shown in this peatland terrain in Churchill, Manitoba.  Photo by USGS

This changing arctic landscape  increases the threat of fire and new species of trees are showing up that have never been seen before.  That’s scary.

Permafrost is any rock or soil that has remained under 32˚ degrees F for over 2 years.  The Bank Island video showed many images of thawing permafrost. They estimate by 2100, the permafrost will be thawed to 11 feet. Ouch!

The interactive Mountain of Ice video showed sea levels 20000 years ago that were 400 feet lower than today.  What ancient villages are off the coast of the United States?  Submersibles should be scouring the bottom for more clues!

The rest of the videos showed great black and white photos taken hundreds of years ago and compared them to recent photos taken in 2004.  What I found so interesting was the amount of contrast and quality those old photos still possess.  I would rather look at those old photos than the washed out digital we have today.

Since 1850, the world’s glaciers have lost 30% of their total surface area.  That’s a lot of melting. 

So the fact that the world’s temperature has risen 1 degree F the past 100 years is starting to become a big deal. 

The Doing
 
Glacier study here in Southcentral would be a great way to introduce glaciers and global warming to a group of Anchorage area students.  Isostatic rebound were their school lies in the Anchorage bowl was over 1000 feet.  Imagine that. 

So much of the topography around the Anchorage Bowl and surrounding mountains is due to glaciers.  Carving turns in the Glacier Bowl above chair 6 at Alyeska wouldn’t be possible without the cirque carved by a glacier.

Portage Glacier still provides clues on the movement of these giant masses of ice.  Here are photos of scratches left by the mass of rock and ice as the glacier moved through the Portage valley.
Portage Glacier 2007. photo by author

Scratches in nearby rocks made by glacier.  Photo by author

The best site on our module would have to be the extreme Ice survey.  The time elapse photography was amazing.  Any teacher working with curriculum that deals with erosion and glaciers should use this site.   Way cool.

Another was the methane bombs being lit by the teachers and students of UAF.  I saw this in Portage one winter and can’t wait to find some pockets of CH4 around my house to light (to the chagrin of my wife….”you are NOT bringing the kids!).

This module got me thinking on how I could explore this in the classroom.  How about finding Permafrost on other planets!  Of course NASA is already exploring that with the Phoenix.
There are also UAF resources for exploring permafrost right here in Alaska.  Google Earth and Permafrost make a great connection.

What really interested me was the isostatic rebound of the land around Anchorage.  The topography around here is a natural field trip right out the door.
From this map, you can see the various landmasses and features made by glaciers. Source http://www.alaskageography.com/essays/glaciers.htm

I have heard of rebounds in the thousands of feet but could only verify under 300 feet.  But just imagine how much rock and ice must have been on the flats to lower it even that much.

The Shameless Plug

http://www.williwaw.com/magento/index.php/weather-calendars-and-publications.html
I can't leave this weeks blog without a mention about the nice folks in Haines that put out the Alaska Weather Calendar.  I have been giving and receiving these wonderful calenders since late '95 and I can't tell you enough about how much Alaskan weather photos and facts they stuff in there.  Check out their site and check up on the winter forecast and other goodies they have.
 Stay safe and have a very cheerful Christmas Solstice.  If you are in the Indian Valley look for the bonfire to the North.  The pagans will be celebrating the longer days to come at December 21st at 2:38 pm. 

Also look for the lunar eclipse that will happen late Monday night!

The Other Voices

First stop was the wonderful site from Marilyn that turned me on to Antonio Stradivari's violin making and the wood used during Europe's little ice age.  Wow

Next I went a blogging to Bobbi-Ann's site and wondered how she could work with those fish swimming all around her page?  Thats pretty cool.

Dave's site is pleasing to the eye.  The photos in the background make it look so professional.  I also agree that the climate data out there can be interpreted so many ways and  we need to keep an open mind about the data and solutions to the problem.


Thursday, December 2, 2010

Module VIII The Cryosphere


Turnagain Arm (photo by author)
“Kryos”  The Greek word for cold. 

Consists of all the frozen places on the Earth.  It is seasonal and can increase and decrease with Earth’s revolution around the Sun.


It’s made up of:  Snow
                           Ice
                           Sea Ice
                           Glaciers
                           Ice shelves           
                           Icebergs
                           Frozen ground. (Permafrost...)

Locations of the world include the North and South Pole (Arctic and Antarctica), mountain regions, and the northern climates of Russia, U.S. and Canada.

Looking for maps and an atlas?


photo from http://nsidc.org/


Still not impressed?  Watch a movie from NASA.

Other great current images can be found at The Cryosphere Today website.

For my own background, I found a website that dealt with actual research on the Cryosphere.  I found papers on the Greenland freshwater runoff to measuring albedo in the Himalayan Basin.  Yes, a little over my head but fascinating for a science teacher.

From viewing the TD videos, we saw how the Arctic climate influences those that lived there, so I wanted to find out some specific changes to the ice and snow cover and their effect on the indigenous people of Southern Greenland.

I went to the  INUIT Circumpolar Council website and found a publication that listed some of the changes local people have noticed due to the changing climate of Greenland.

  • Many mentioned that local glaciers were receding- so much so that the landmarks naming these glaciers were no longer correct!
  • Because of less snow cover, berries such as the Crowberry have become scarce.
  • Ice cover on the beaches has all but disappeared in the winter, thus moving animals to different areas and making traveling on ice dangerous.
  • The native people of Southern Greenland also have seen an increase of algae on the skin of seals and their boats.  
  • (An interesting observation I have also noticed here in South-central. My roof is covered in moss and algae as is the north sides of the cottonwoods around my house.  More so than any other year.)

Permafrost has always facinated me and seasonal frozen ground has always been a struggle especially when digging the biannual outhouse hole out at camp.....

photo from the virtual tunnel tour http://permafrosttunnel.crrel.usace.army.mil/
As a kid, I got the chance to tour the permafrost tunnel up in Fairbanks and the experience has left some special memories for me.  We went from 80 degrees to long underwear weather in a matter of seconds into this cave where frozen boulders looked to topple over on us at any moment to preserved animal remains thousands of years old.

Evaluate

I am looking into using vernier probes more in the classroom , (I just wish I had newer laptops).  The activity looking at white and black paper and how they might influence the temperature of a liquid could easily be modified using temperature probes.   

Beginning of the year scientific method activities using probes and the concept of albedo would make for some exciting discoveries for new eighth graders.  Comparing the reflected light of different surfaces would allow my students a great hands on activity for exploring this concept.

The TD diagram on Arctic Sea Ice Observation  would also let students use data to compare the area and square kilometers of the ice pack for the past ten years.  STEM should be all over this.

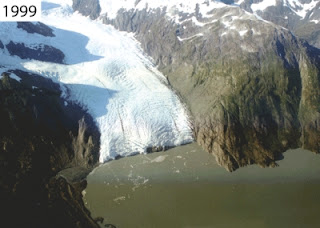
The tour of the Cryosphere was one of the best tools for students to see the different locations and extent of the Earth's frozen areas.  I couldn't believe how fast the Jakobshavin Glacier was moving!  5 feet an hour!  I have grown up watching Portage Glacier move farther and farther back, and I certainly can relate to what the Greenlanders must be going through.

Here are some photos from the Portage Glacier USGS site (see above) that shows the receding glacier from when I was seven years old, to graduating from high school, to the year I became a full time teacher in Anchorage. 


1972, USGS photograph; 1984, Aeromap U.S.; 1999 and 2006, USGS photographs.
Evaluate

This module about the cryosphere was very interesting to me.  Not only for the educational tools but the wealth of information about the science out there about my favorite season of the year.  I can't wait to enjoy that frozen water on my skis in the Chugach mountains behind my house.  Sunglasses in March?  I blame the albedo....

Comments

Doug had a great module this week.  I found a book recommendation for Wohlforth's  The Whale and the Supercomputer.  

Marilyn lead me to the National Ice Center, where I found links for .kmz files for my new passion: Google Earth.

Clay was right on about Lila's site.  I found it interesting and full of relevant science. 

    Monday, November 22, 2010

    Earth's Climate Connecting to Geological, Biological & Cultural Systems

    Explain

    We started with an interesting dichotomy:   If it wasn't for Global Cooling, the Beringia land bridge wouldn't have formed, making it impossible for the influx of new inhabitants to North America.

    It it wasn't for Global Warming, large areas in North America could not have been inhabited because of the glacial ice sheets.


    You win some.  You lose some.

    The soil microbes ability in the Arctic to produce CO2 in large quantities is an amazing feat during the winter months.  Down to -7˚C! The video also reminded me of the old adage about the teachers in the bush leaving like flocks of birds when summer came.  Scientists are just touching the proverbial iceberg of learning about the Arctic in the winter months. 

    What confused me about the CO2 production by the microbes and climate change was the nagging question, are the microbes to blame?  What evidence was there that this is a natural occurrence and not an abnormality?

    image from powells.com
    My 8 year old son and I watched the Inuit observation video and he could not contain his excitement about a book he just read that followed a native family living in the Arctic.  The book Neeluk, follows the seasonal adventures of a young Inuit boy.  It takes place at the turn of the century, several years before the 1918 flu epidemic that killed so many.  Elementary teachers should take note. 

    I have heard locally about the abundance of certain insects and spiders in Alaska the past few years.  Some mountain running buddies remarked how many spider webs they came across as they were cruising the alpine areas around Anchorage. The Yellowjackets were out of control around my house in Indian Valley the past two summers as well.  Climate change?

    The formation of all of Earth's elements was a real eye opener for me.  The fusion video where the two scientists are filling up the periodic table of elements was an effective approach to learning where our first 92 elements came from. 


    The interactive periodic table will be one of the first to go on my new Promethean white board!

    Extending

    For the past several years, I have introduced my Astronomy unit with the formation of the stars and their chemistry.  I have a lab that excites the kids (because they use Bunsen burners), about the elements and how the electromagnetic spectrum helps Astronomers study the stars.  The lab is a simple flame test using simple salt mixtures and the characteristic flame associated with each element.  The study of stars leads to fireworks, which leads to the elements.  It works out great.
    http://en.wikipedia.org/wiki/Flame_test
    I will be using the Fusion TD video from now on to help introduce the periodic table and my unit in chemistry.  What a great visual. 

    Check out the new element book and cards for your classroom.  (Sorry I just love books!)

    Evaluate

    As I mentioned before, the videos that explained the formation of the elements and the mircobes in the Arctic were useful and filled with science a middle-schooler could grasp. 

    I had trouble with the carbon cycle diagram and explanation.  It was hard to read and interpret.  I find simple diagrams easier to read for middle-schoolers.  

    Knowing that Genghis Khan's carbon is still out there and might be in the next steak you eat is a fun way to introduce nutrient cycles

    Comments

    I first visited Kenai Kathy's site and commended her on her great resources for a food web unit.  The game will come in handy along with my PLT curriculum.

    Next I went to Tyler's site and found two great lessons through the links form Alaska Project Wild and Alaska Resource Forum

    Finally, I went to Matthew's blog and came away thinking he and I have the same Alaska reading list!  I couldn't believe the contamination of the Canadian caribou herd from Uranium. 


    Sunday, November 14, 2010

    Module VI Weather Connections

    How are the Earth, atmosphere and cultures all connected?

    Explain
    The Arctic Haze segment really caught my eye.  Driving into Anchorage every morning I see this brown haze hanging over the Cook Inlet and Fire Island area.  The dust kicked up by the largest city in Alaska is really evident in the wintertime.  

    Those on the North slope have been accumulating heavy metals for years.  It reminded me of the story of the Atomic Agency Commission and their quest to blast a harbor out with an atomic bomb along the coast of Northern Alaska.  The potential for radioactive material to enter the food chain from the lichen to the local people was frightening.  Check it out in the Firecracker Boys.   
     The interaction of the wind, temperature and pressure in our troposphere is an important part of our day out in Bristol Bay.  The sonar site I work at on the Nushagak River counts up to four of the five species of salmon going up to spawn.  Big winds bring the fish (along with high tides) into the bay and we more often than not, get slammed 24 hours later.  It seems we are always looking for which way the wind is blowing.  Not only for the fish passage but some of our tents leak! 


    Extend
     My 8th grade class does little in the study of climate and weather, but I did take a very helpful online class offered through National Geographic's Jason Project.  The curriculum I took was Monster Storms and it contained a complete unit with curriculum, interactive labs and online games.  We looked at how a monster storm, i.e. hurricanes and tornadoes form and the science and researchers behind it.


    I am also using their geology unit Tectonic Fury to supplement my own curriculum for earthquakes, volcanoes and plate tectonics.


    Another resource all Alaskan teachers should have is the book The Climate of Alaska. This resource is filled with climate information from Alaska's temperature and humidity to the climate of selected towns across Alaska.  


    The authors discuss the difference between climate and weather and the controlling factors that make Alaska's climate.  Fun Facts abound for the curious throughout the volume.  One in particular describes the density of humid air with that of dry air.  I know, I thought it the other way around?!


    The book also looks at growing seasons around the state and I thought of a connection with the local inhabitants.  In the Interior, the growing season is around 100 days but along Lake Minchumina, the season is extended due to the lake's maritime influence.   


    Another section looks at the effects wind has on humans and the environment.  Did you know there have been four reported cases where a tornado touched down in Alaska?  From above the Arctic Circle to areas around Anchorage and Cook Inlet.
    http://www.gi.alaska.edu/ScienceForum/ASF19/1977.html
    Pressure and its importance to climate in Alaska is another area where this book relates to our module this week.  The "semi-permanent" low pressure area called the Aleutian Low sits off the Aleutian Islands and is the driving force for most of the storms that affect Alaska's western and southern coasts.  I tried to find it on our Google Earth search but its occurrence is mostly in winter.
    Image from Google Earth
     
    Evaluate 

    The Discovery video  and graphics were wonderful this week.  My understanding of weather systems was lacking, (in particular pressure zones and the formation of the Gulf Stream) and those videos really helped in my understanding of this weeks module.

    photo by author
    Some fun ways to explore pressure in the classroom is to have a smaller student jump into a very large garbage bag and have them hold the edges tightly around their necks.  I start my trusty shop vac and hand the nozzle to the student.  He or she then grasps the end and sticks it partway down the opening around their neck.  I turn it on and "take" all of the surrounding air from the bag.  The student is now vacuum packed and they can feel the surrounding air pressing on them from the classroom.

    The vertical structure of the atmosphere would make a great flip-book using Dinah Zyke's graphic organizers and lessons.

    Labs with probes is a great way for students to check out the phases of matter. I use the Vernier probes and their middle school lab manual is filled with  labs already to go!  Software is free too.

    Comments 

    I found Sabrina's pic from the Kodiak Island tsunami to be frightening!  I will definitely use some in my earthquake unit. 

    Alison has a really nice site and it is easy to read.  We both find the apathy of our students to be a little disheartening at times

    Cheryl has a great diagram of a guyot.  Check it out.  Way cool.


    Sunday, November 7, 2010

    Module V The Ocean, The Science, and Our Connection

    The Learning
    The science behind the Gulf Stream was very interesting.  I couldn't believe the connections to the convection currents occurring in the athenosphere and the convection cells in our atmosphere.  I have been following the chemical changes in the ocean for several years and found the salinity changes to be a big part of my own curriculum when it comes to density and freezing and boiling points.  One of the first labs we do is look at how and why a solute can lower a solution's melting point and why the DOT is salting our roads.  Its an eye opener for the kids:  "But I thought the salt melts the ice?"  "Doesn't the salt give the sidewalks some traction so we don't slip?"

    Google Earth
    Here is my Google Earth image of the Gulf Stream and the continental shelf off the East coast.  How similar they appear!
    Google Earth

    www.eathmagazine.org
    I found several great articles in my favorite magazine Earth-(formally known as Geotimes).  One article in particular follows the interview of geochemist Wally Broecker who discovered the connection between the massive systems of currents that move large amounts of heat and salt around the planet. 
    For the teacher, it shows an insiders take on doing good science, how facts come together and how hypotheses are formed and tested.


    http://www.environmentalgraffiti.com
    I had taken a class with some colleagues awhile back that included some of the new research going on under the sea with submersibles.  I found some of the pictures to be fantastic and one topic that might relate to our Module this week.  There are huge salt lakes under the Gulf of Mexico that blow your mind when you see the video.  I could not find the original video but found some websites that talk about the natural history.


    The Connections
    One connection to the people that inhabit those coastal habitats and the changing ocean is the biochemical change I have been following closely for 3-4 years.  Ocean Acidification can have huge effects on those people that rely on ocean resources especially shellfish.  My students have seen the connection with their everyday uses of acids and bases.  Our chemistry unit looks at acids and bases, especially on how to measure and identify.  The above website really give the layperson a good resource on how acids can be damaging to the oceans with increased carbon dioxide production.  Imagine clams, oysters,and other shell fish not being able to  make their protective shells and the damage to those that rely on this resource:  Sea mammals to humans.

    The module really makes connections between the sun, Earth, its winds, oceans, and the interconnections of a truly living and breathing entity.   Is Gaia alive and well in the 21st century?


    The Resources
    Google Earth continually amazes me and I am glad for the hands on assignments that "make" me explore the program.  I think the add content option to be a great addition to my classroom.  The real-time earthquakes KML files are an excellent teaching tool.

    The YouTube videos were another matter.  ASD has given teachers a little more leeway to access the content from the classroom, but the passwords and hoops you must go through really make it not an easy resource to use. 

    The discovery videos on the other hand are easy to use, download and manipulate for archiving for next year's lessons. 


     Some Comments
    Cruised to Eric's blog and found a great creation myth shared by both the Maori  and Hawaiians.
    Next I went to Janet's great site and found links to ocean alive I would love to use in my classroom.
    More great resources from Cheryl and the Lake ice studies happening here in Alaska!


    Had to share this pic of the Comet flyby.  Cool stuff happening every!
    NASA's Deep Impact (EPOXI) probe flew past Comet Hartley 2 only 435 miles from the comet's active nucleus    


    Sunday, October 31, 2010

    Seward's Tsunami Signs and Module IV comments

    • Tracy has a great suggestion about interviewing those older Alaskans that went through the '64 Quake.  What would we do without water, power, and the cell phone?
    • Food and geology.  Some of my favorite subjects!  Thanks Dominic (Nick) Pader
    • Winsor is blowing thing up in her classroom but I have wait until Chemistry.  Great lesson ideas!